
As urban congestion and living costs continue to evolve, many commuters are re-evaluating their daily transportation choices. This article provides an objective, data-driven analysis of the real financial implications of owning and operating an e-bike versus a traditional car for the average 2026 commuter. We delve into purchase price, maintenance, fuel/charging, insurance, and hidden costs to offer a comprehensive breakdown that informs your decision.
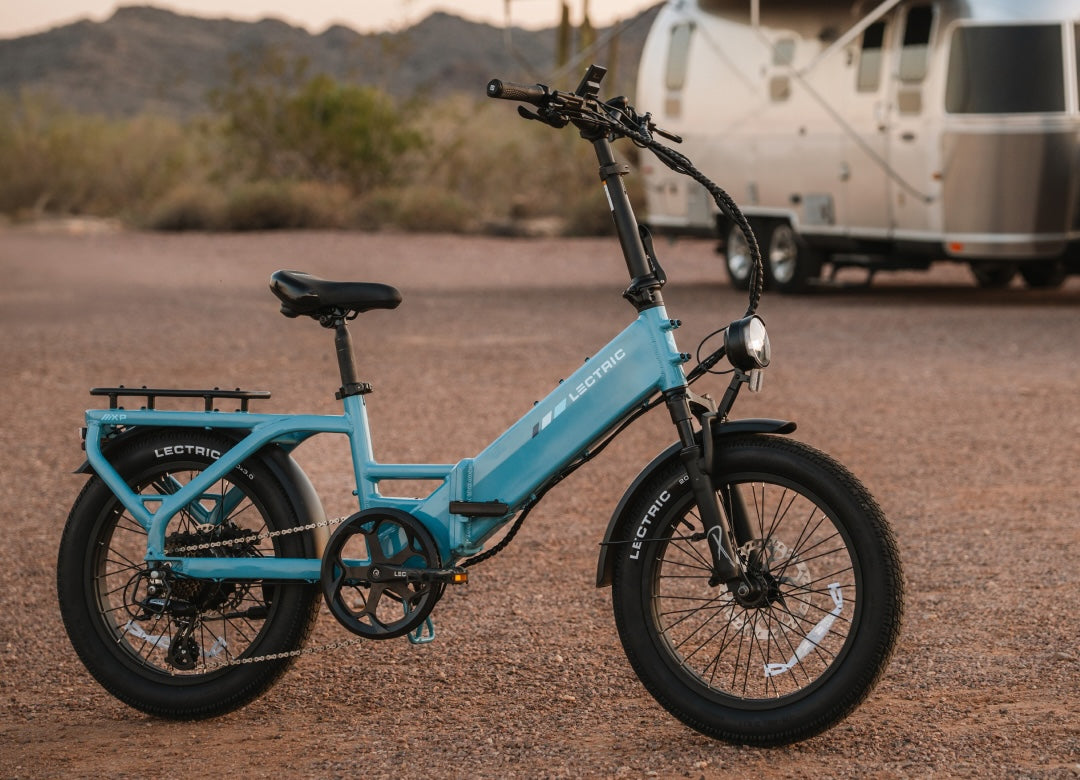 Top Pick
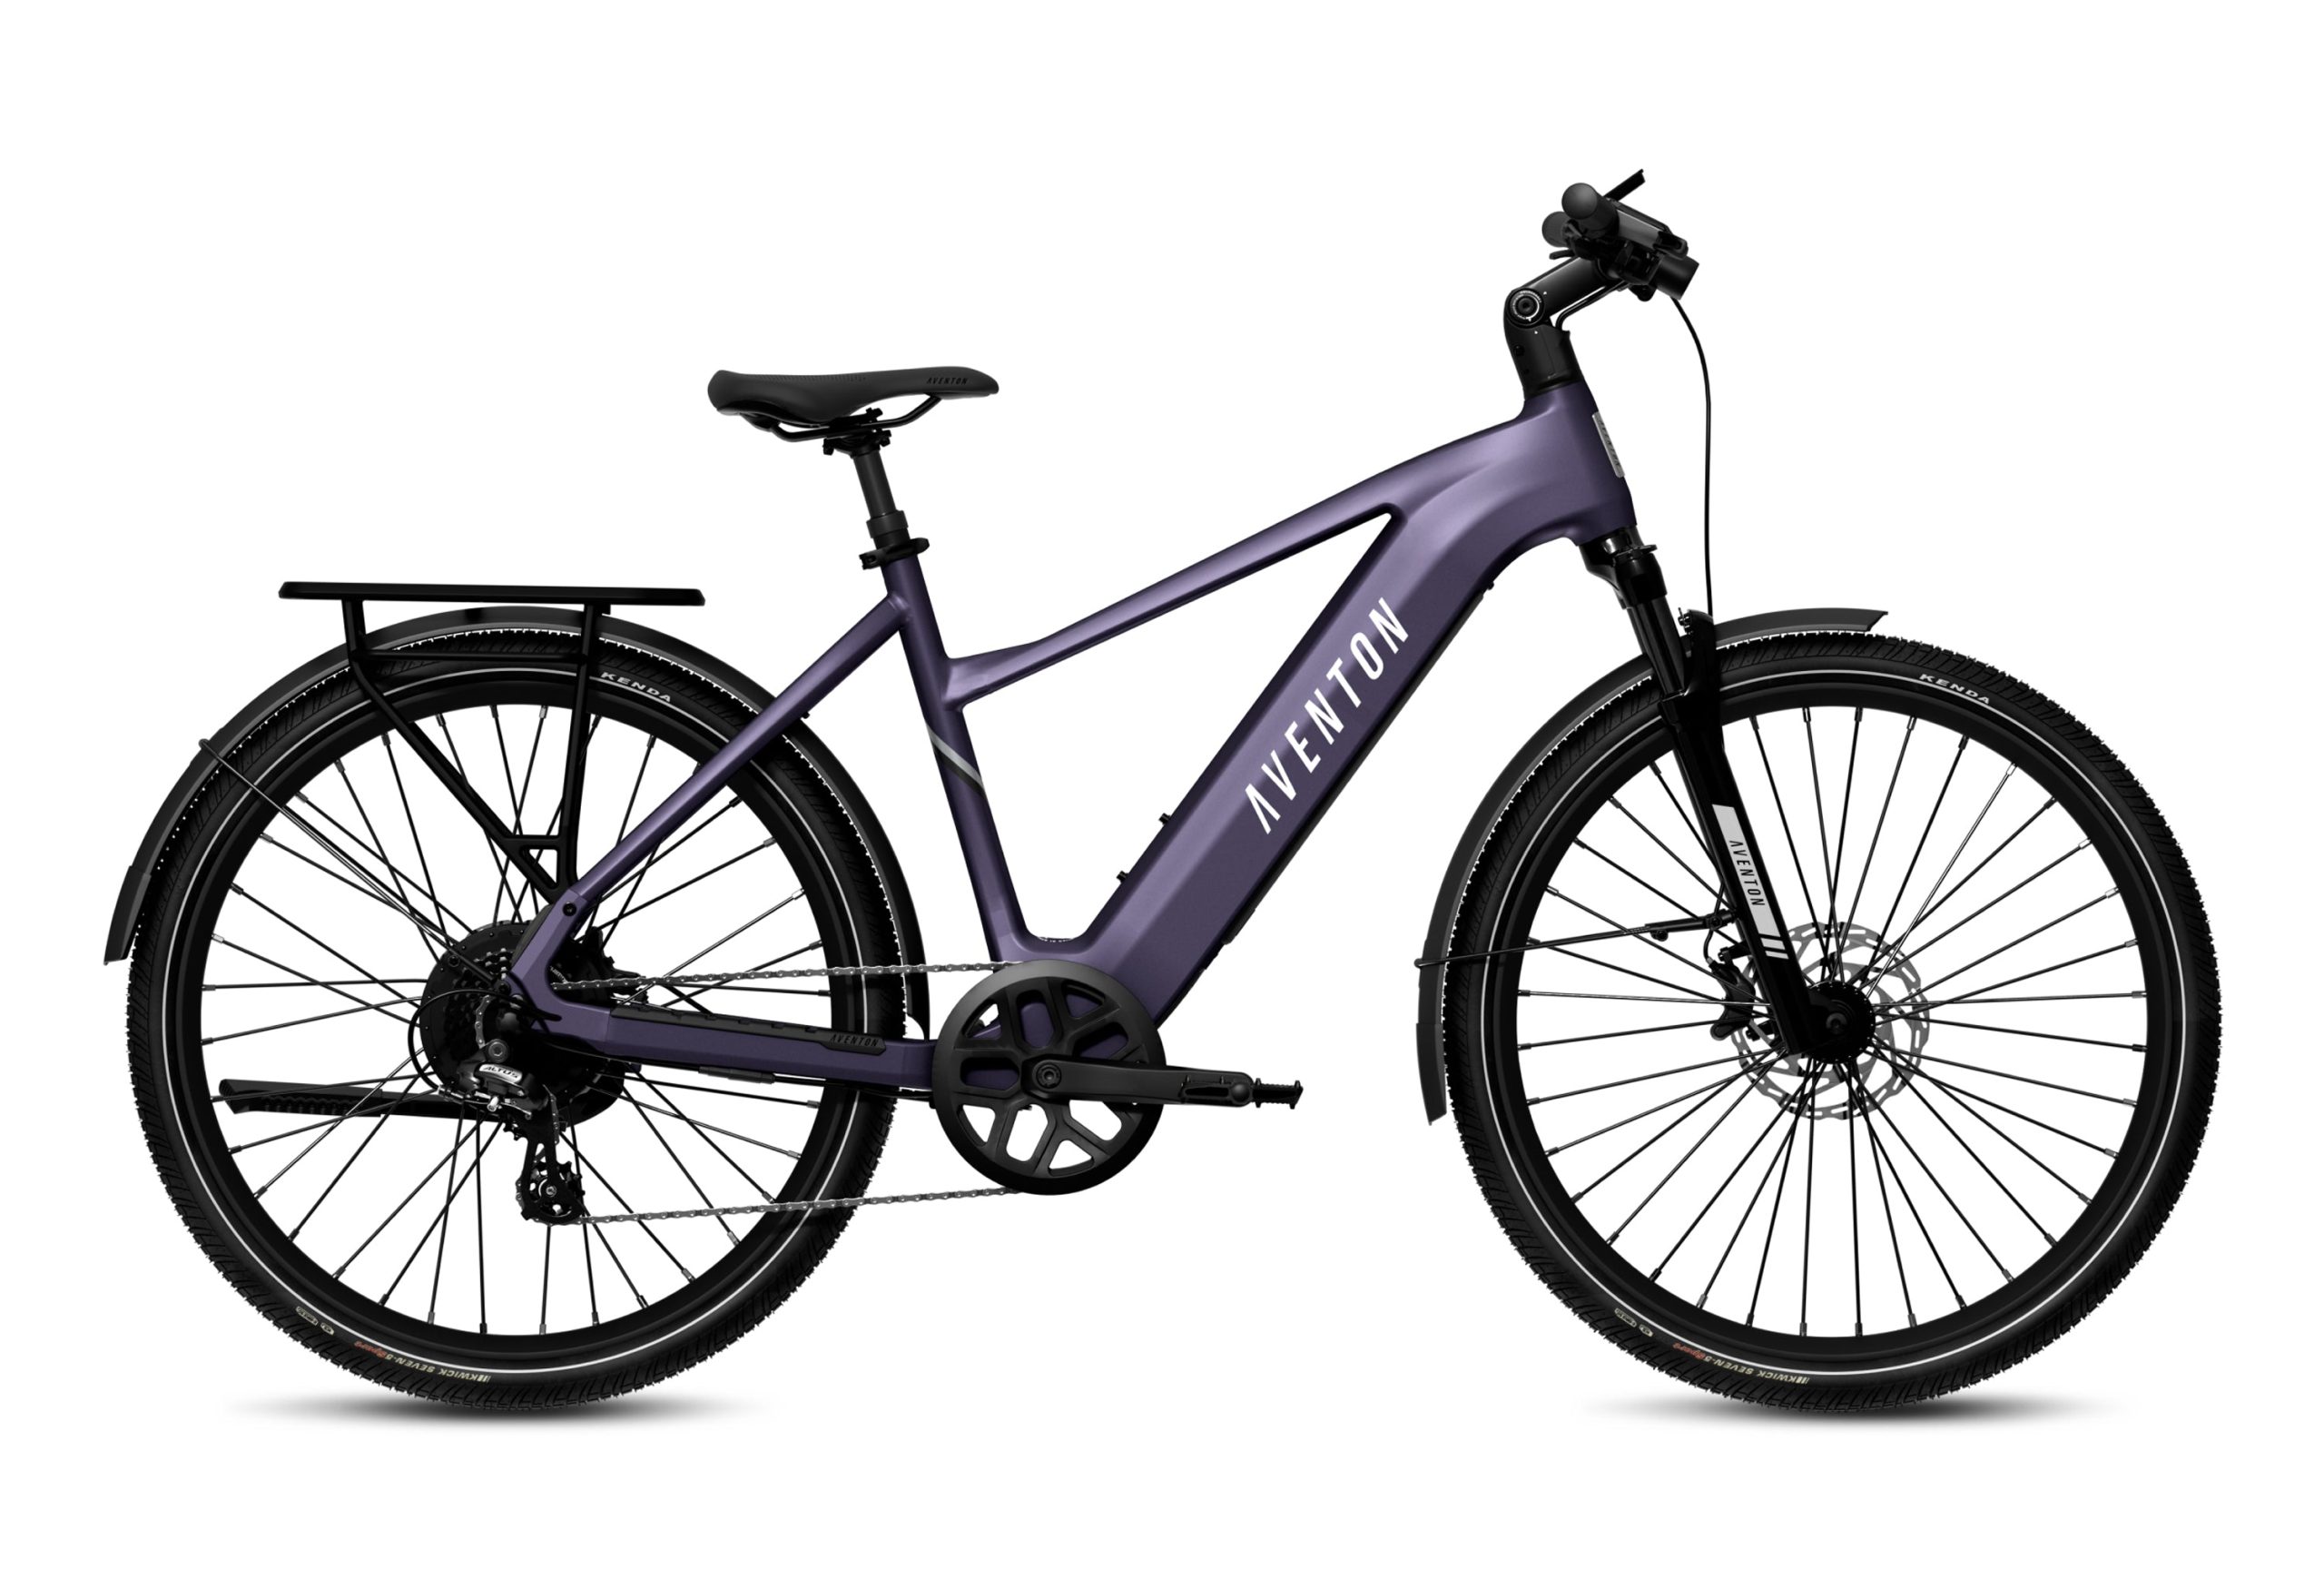 Best Value
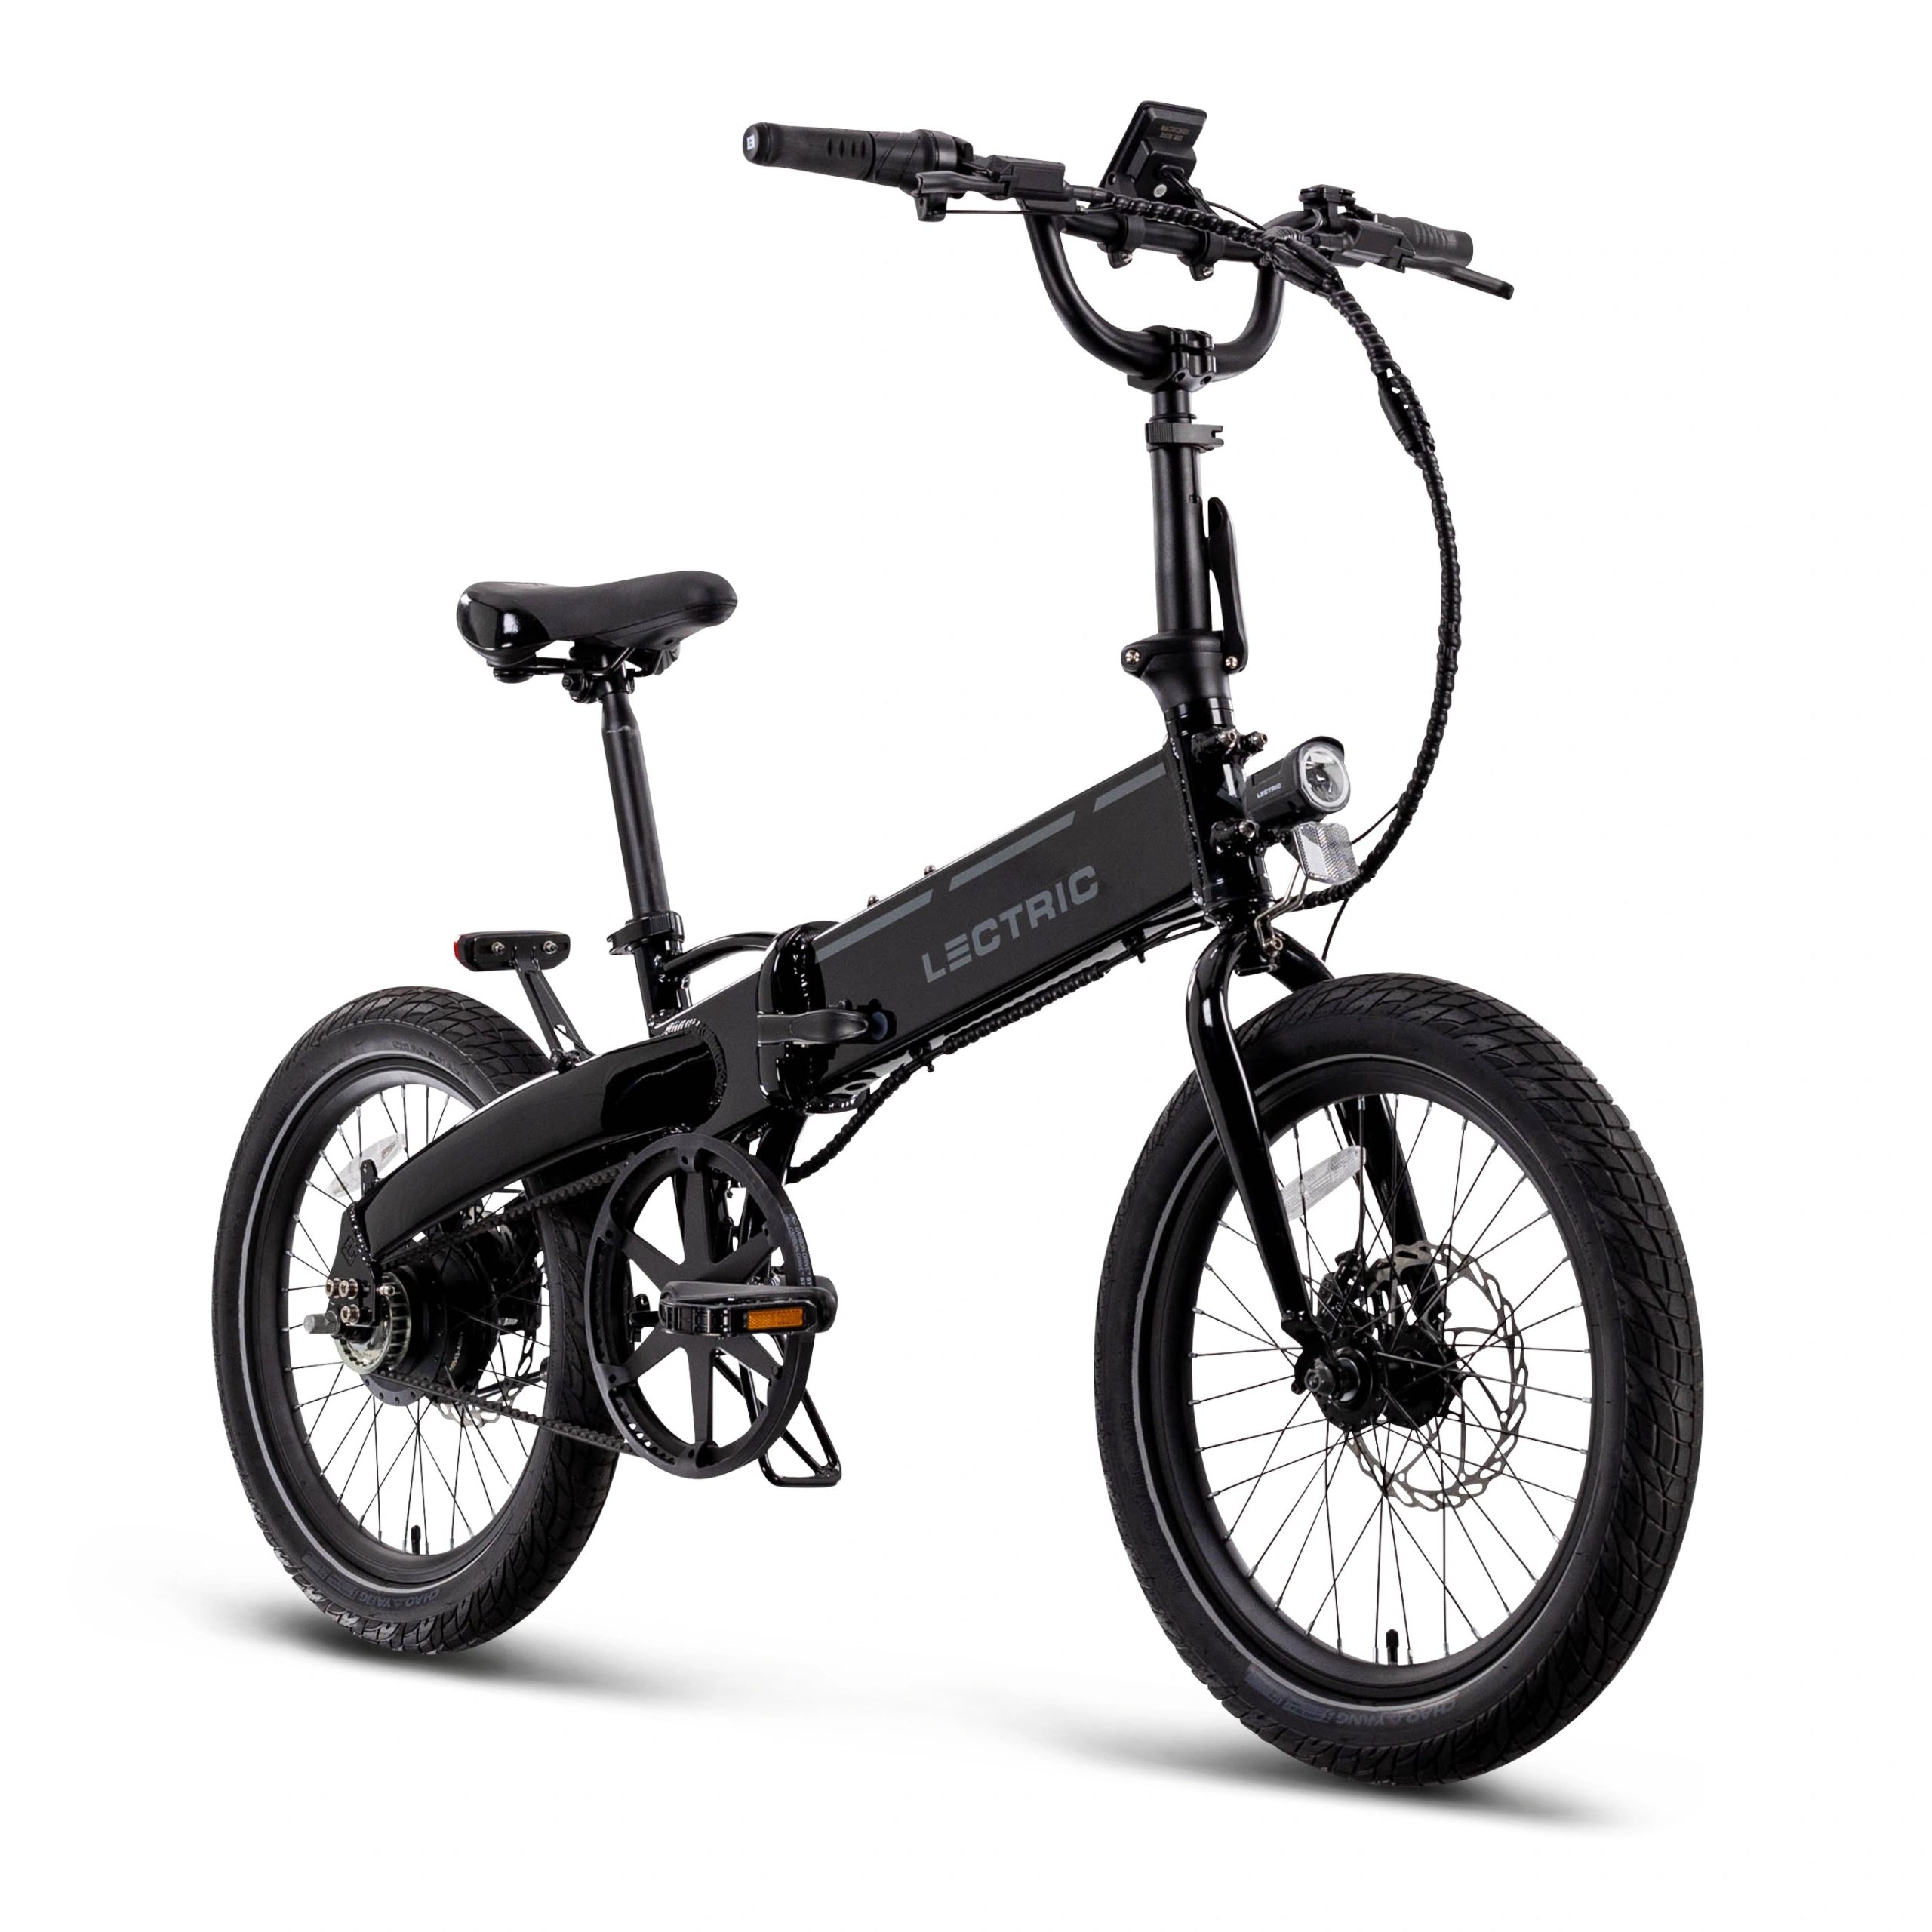 Premium Pick
 Budget Pick
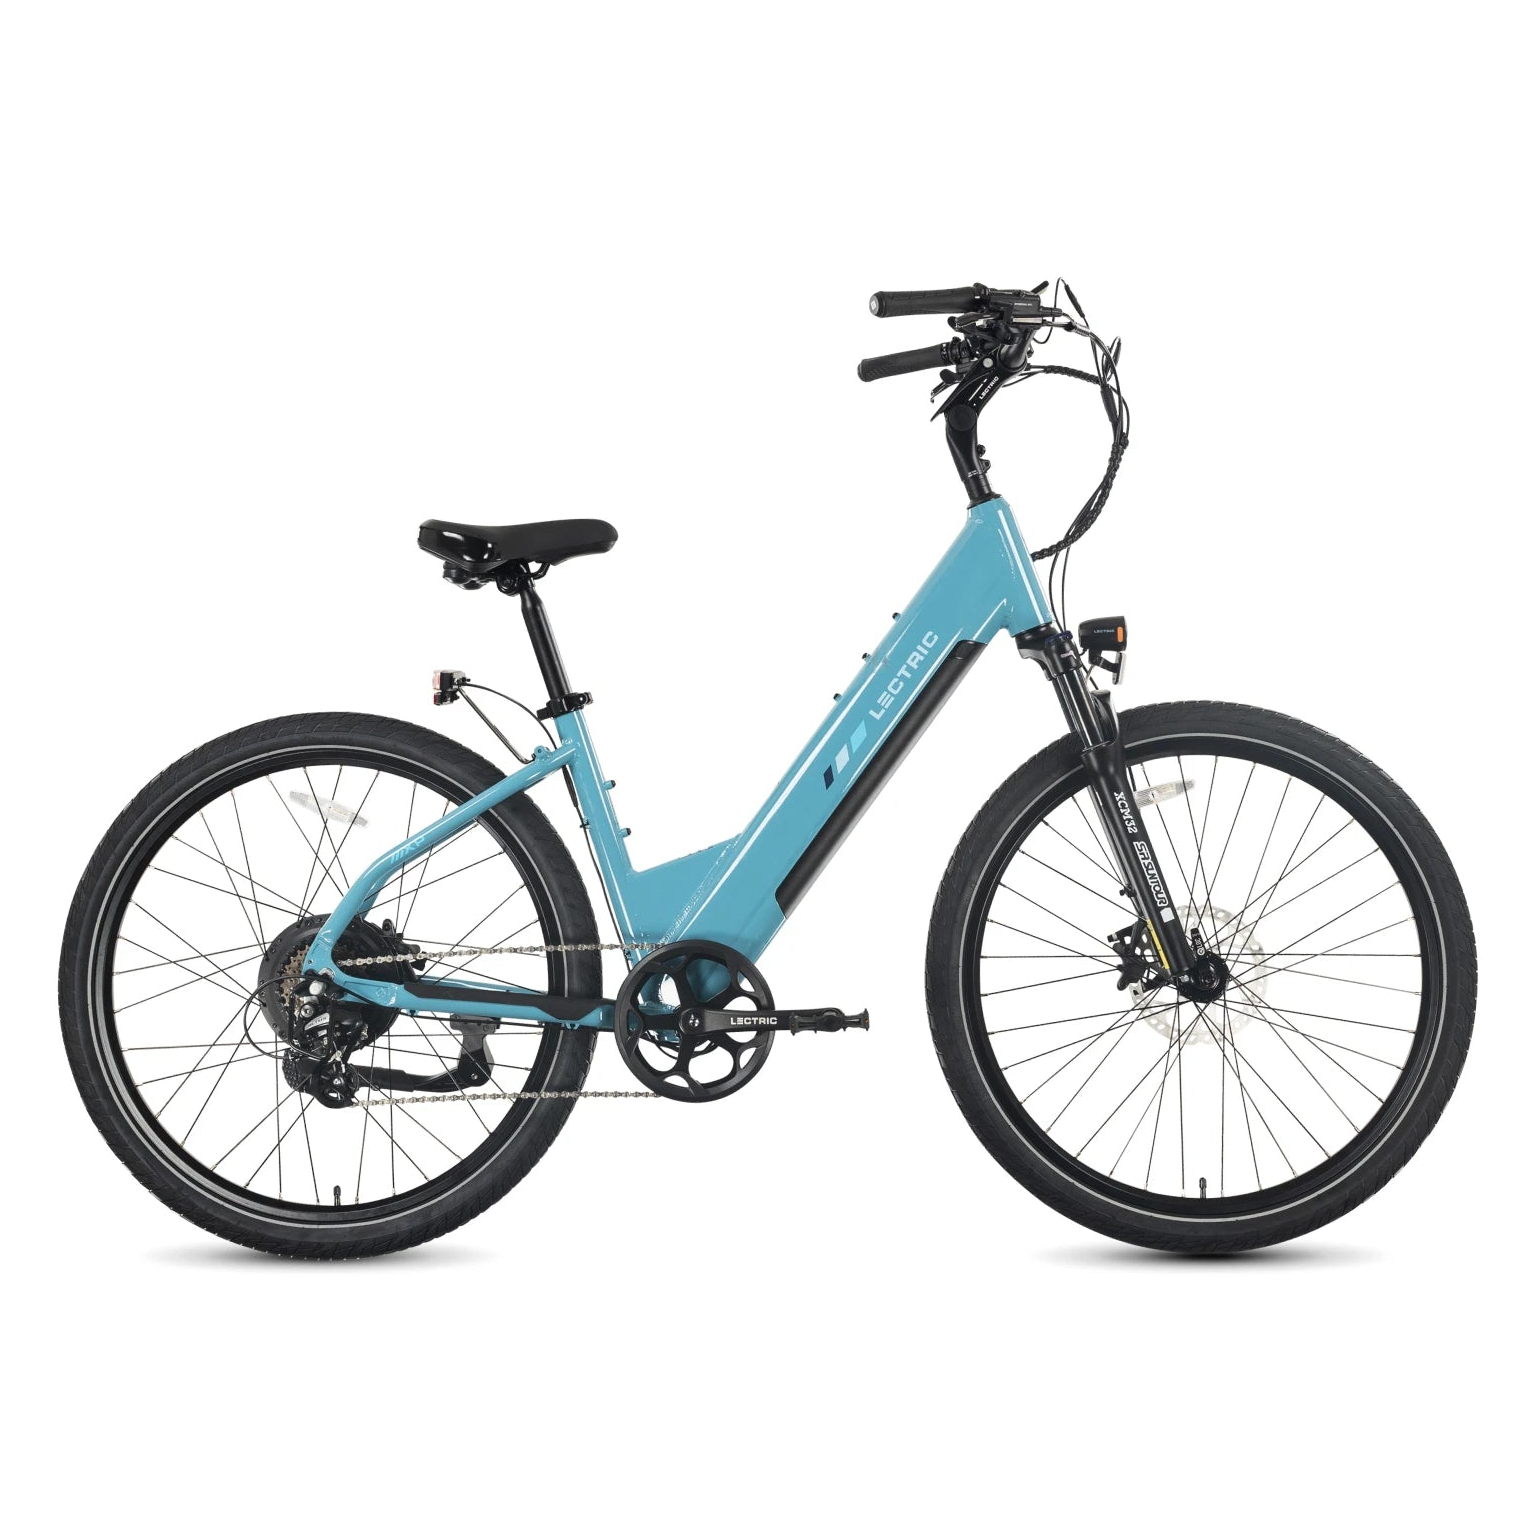 Also Great
Why This Comparison Matters More in 2025

Most cost comparisons between e-bikes and cars focus narrowly on sticker price or fuel savings. That misses the point. For a daily commuter in 2025, the number that actually matters is total annual cost of ownership: purchase price amortized over several years, plus fuel or charging, maintenance, insurance, and parking. When you stack all of those figures together using current published data, the gap between e-bike commuting and car commuting is larger than most people expect — but it comes with real tradeoffs worth understanding before you commit.
The Upfront Purchase Gap Is Real — But Shrinks Over Time

A new commuter e-bike in 2025 typically costs between $1,200 and $5,000, depending on the category. Based on current U.S. pricing from manufacturer and retailer sources, the market breaks into three practical tiers:
- Entry-level commuters ($1,200–$2,000): Models like the Aventon Soltera ($1,200–$1,400) and the Ride1Up 500 ($1,200–$1,500) cover the basics — usable range, reliable motors, and low running costs — without premium features. These are the easiest to justify financially for a short-to-medium commute. best electric bikes
- Mid-range daily commuters ($2,000–$3,500): The Rad Power Bikes RadCity ($1,700–$2,000) sits at the lower edge of this bracket, while models from Lyric Cycles extend into the $2,000–$4,500 range. These bikes typically add integrated lighting, rack mounts, better components, and longer-lasting drivetrains — all of which matter for daily use.
- Premium commuters ($3,000–$5,000+): The Trek Allant+ and Specialized Turbo Vado both fall in the $3,000–$5,000 range. These offer refined rides, larger batteries, and brand-backed service networks — meaningful if you’re commuting 20+ miles daily and want a bike that holds up over years of hard use.
Compare that to a new car. Even a modestly priced new vehicle in 2025 carries a sticker price that is a multiple of even the most expensive commuter e-bike. The upfront cost advantage for e-bikes is substantial and unambiguous. The more nuanced question is what happens over a three-to-five-year period when you factor in everything else.
Operating Costs: Where E-Bikes Pull Far Ahead
This is where the data becomes striking. Published cost analyses consistently show e-bike operating expenses running dramatically below those of car ownership, across every major category:
- Charging vs. fuel: A full e-bike charge is estimated at roughly $0.10–$0.20 based on typical U.S. electricity rates, with annual charging costs for a regular commuter estimated around $20–$50 per year. Gasoline costs for a car commuter are orders of magnitude higher, and 2025–2026 analyses note that fuel price increases are widening this gap further.
- Maintenance: Annual e-bike maintenance — covering brake adjustments, drivetrain service, and tire replacement — is consistently estimated at $100–$300 per year in published ownership analyses. Car maintenance, including oil changes, tire rotations, brake jobs, and unexpected repairs, runs significantly higher for most owners.
- Insurance: Most e-bikes require no dedicated insurance policy for road use (check your state’s specific rules), while car insurance represents a fixed annual cost that can easily exceed $1,000–$2,000 per year in many U.S. markets.
- Parking: Urban parking costs are effectively zero for most e-bike commuters. For car commuters in mid-to-large cities, paid parking can add thousands of dollars annually to the real cost of commuting.
One published five-year analysis cited annual savings exceeding $8,000 for commuters who replaced car trips with e-bike commuting. That figure reflects specific usage patterns and should be treated as a high-end scenario rather than a guarantee, but it illustrates the scale of potential savings when all cost categories are included. e-bike commuting guide
Key Specs That Determine Real-World Commuter Value
Not every e-bike delivers equal value for commuting. The specs that matter most for daily use are:
- Battery capacity and range: A 500Wh battery typically supports 30–40 miles of real-world range, while a 750Wh battery can extend that to 50–60 miles. For most urban commuters, 30–40 miles is sufficient. For longer or hillier routes, battery size becomes a critical purchase decision.
- Motor power: Commuter models in the current market range from 250W on some European-style bikes to 500W–750W on utility-oriented U.S. models. Higher motor power helps on hills and with cargo loads but can reduce range.
- Cargo and accessory compatibility: A commuter e-bike that can’t carry a bag, laptop, or groceries has limited practical utility. Rack mounts, integrated fenders, and pannier compatibility significantly affect whether a bike can replace car trips in real life — not just in theory.
- Battery replacement planning: Multi-year ownership models explicitly include battery replacement as a recurring cost. This is a genuine long-term expense that should factor into your purchase math.
The Honest Tradeoffs
E-bikes win on operating cost by a wide margin. But a credible comparison requires acknowledging where cars remain genuinely superior:
- Range and flexibility: No commuter e-bike matches a car’s ability to handle a 200-mile day trip, inclement weather, multiple passengers, or large cargo. Real-world e-bike range is finite and model-dependent, typically 20–60 miles per charge. This is a hard constraint, not a minor inconvenience.
- Weather and safety exposure: Commuting by e-bike means riding in traffic, rain, and cold. This is a lifestyle consideration that cost comparisons rarely quantify but that matters enormously to real commuters.
- Upfront cost for entry-level buyers: Even the most affordable commuter e-bikes start around $1,200–$1,500. For commuters without that available, the financial math on e-bikes doesn’t work regardless of long-term savings.
- Infrastructure dependency: Bike lanes, secure parking, and shower facilities at the workplace vary dramatically by city and employer. In areas with poor cycling infrastructure, e-bike commuting carries additional friction that doesn’t show up in cost tables.
The Bottom Line: Who Should Make the Switch
Based on published cost data, the e-bike is the clear financial winner for commuters whose daily trip falls within a typical e-bike’s range — roughly 10–30 miles each way — and who live in areas with reasonable cycling infrastructure. The combination of low charging costs ($20–$50/year), manageable maintenance ($100–$300/year), and zero or minimal insurance and parking costs creates an operating cost profile that cars simply cannot match over a three-to-five-year horizon. e-bike vs car savings calculator
For a commuter currently spending heavily on fuel, urban parking, and car insurance, a mid-range e-bike in the $2,000–$3,000 range represents the best balance of capability and payback speed. Entry-level models under $1,500 work for shorter, flatter routes but may require more maintenance investment over time. Premium bikes above $3,500 are justified primarily for longer daily distances or riders who want a highly reliable, low-friction ownership experience.
The genuine caveat: if your commute involves distances beyond typical e-bike range, regular cargo hauling of significant weight, or reliable year-round riding in harsh weather, a car remains the more practical tool — even if the operating cost is higher. The best financial decision depends on your actual commute, not on an idealized version of it.
Sources
- MovinEV: The True E-Bike vs Car Cost in Canada
- Rize Bikes: The True Cost of Commuting — E-Bike vs Car Over 5 Years
- Mihogo: Bike Commuting vs Car Commuting — The Real Cost Comparison
- Vtuvia E-Bike: How Much Does an Electric Bike Cost?
- Tern Bicycles: Riding an E-Bike vs Driving — How Much Money Can You Save?
- Lyric Cycles: Cost of an E-Bike
- Roxform: E-Bike vs Car Commuting Cost (UK)
Disclosure: This article was produced with AI-assisted research and editorial review. VoltVentureLab.com may earn a commission from qualifying purchases made through links on this page.